Lesson 4: Colorimetry
One useful and often used way of determining the concentration of a chemical in a solution, if it has a color, is to measure the intensity of the color and relate the intensity of the color to the concentration of the solution. Several useful factors are very important. After discussing those important factors and the mathematical summary of them called Beer's Law, we will look at colorimeters, the instruments that you will use to measure color intensity.
Next we will deal with the problem of actually figuring out the concentration of a solution from the absorbance measurements that can be made using the colorimeters by looking at Calculations for Colorimetry. There are three methods that can be used depending on what information is available. They involve using proportionality, graphing and Beer's Law.
Your Lab Work for this lesson will involve puting all of that together when you experimentally determine the concentration of an unknown solution.
Important Factors | Beer's Law | Colorimeters | Calculations for Colorimetry | Lab Work
Important Factors
The most important idea in colorimetry is that color intensity is proportional to the concentration. However, this is not always true, especially at high concentrations and color intensities. Also, there are several other important factors to keep in mind when working with colorimetry.
|
|
|
|
|
|
|
Additional information about some of these factors can be found below.
Complemetary Color
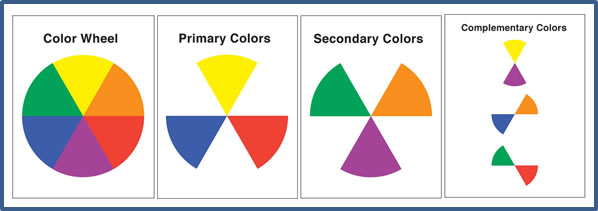
Regarding the color we see being complementary to the color absorbed, let me show you what I mean.
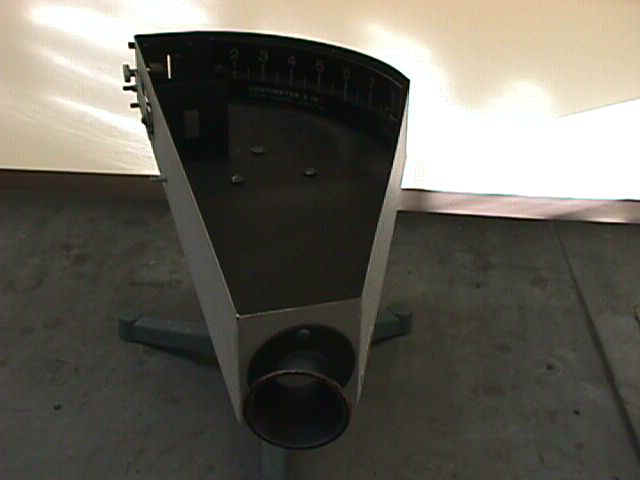
To do that let's quickly review the operation of a spectroscope. Here is a spectroscope. The eyepiece is at the near right end. A slit for light and a clamp to hold test tubes is at the far left end. |
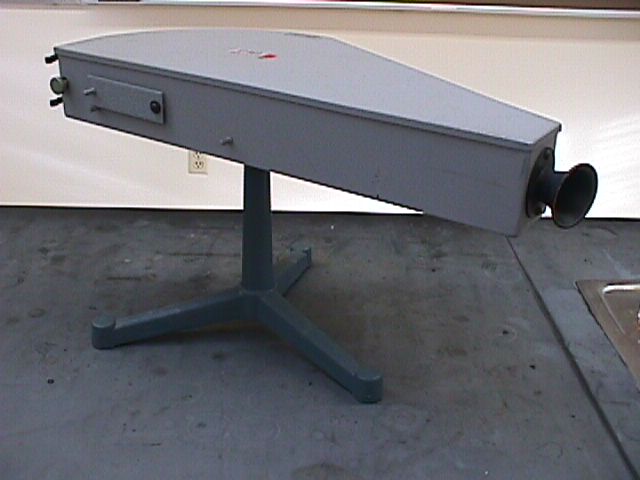
|
Inside, light will pass through the slit at the far end and then through a diffraction grating before leaving through the eyepiece at the near end. The diffraction grating bends the light in different directions. Each color bends to its own new direction. As we look through the eyepiece, each color appears to be coming from a different place, giving us a spectrum of all the colors. If a solution absorbs any of the colors, that part of the spectrum will not be as bright. In fact, it might be quite dark. |
|
Concentration
Take a look at what happens as a green solution is made more concentrated. Start with the full spectrum shown here. (The true colors of the spectrum are easier to see in person in the lab.) |
|
With a dilute solution a small portion of the red light is absorbed, making the right end of this spectrum darker. |
|
When the solution is made more concentrated, more of the red light is absorbed. Although the true colors of the spectrum don't show up in these pictures, you should be able to see that the red end of the spectrum has been darkened (shortened). |
|
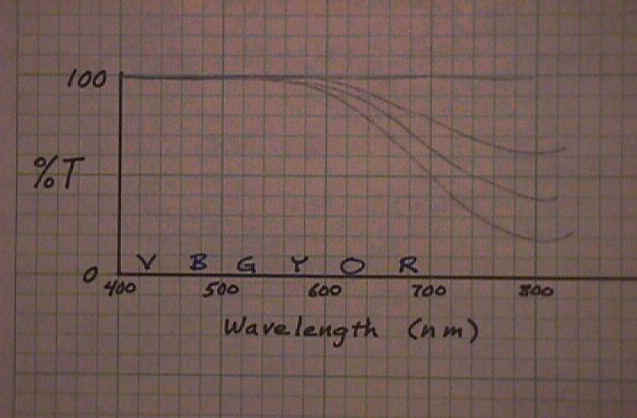
This can also be represented graphically. Here is one way. This graph shows how much light is getting through. %T stands for the percentage of light that is transmitted through the sample. With white light, all of every color gets through. That is represented by the line across the top, 100% for all wavelengths. With a small concentration of the colored chemical, a small amount of the complementary color is absorbed and less than 100% gets through in the 700nm to 800nm range. As the concentration increases the line representing %T drops lower and lower. |
|
Transmittance and Absorbance
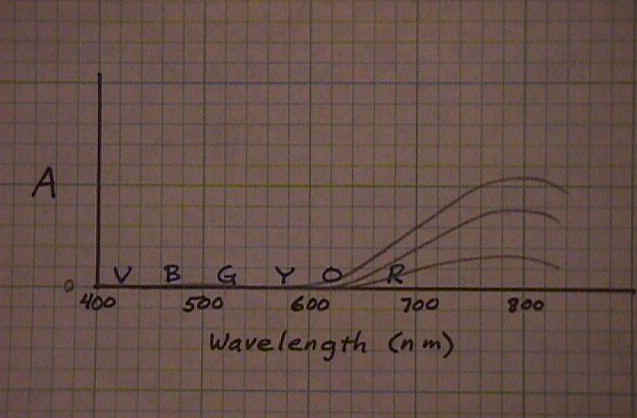
Here is another way of graphing the spectrum of a solution. Instead of showing how much light of each colors gets through the solution (top graph), it shows how much light of each color is absorbed by the solution (bottom graph). With a colorless solution, none of the light is absorbed (straight line across the bottom of the graph). With a small concentration of the colored chemical, a small amount of the complementary color is absorbed (slight rise in the line in the 700nm to 800nm range). As the concentration increases, the amount of light that is absorbed (in the 700nm to 800nm range) increases. |
|
|
Ideally, the absorbance is directly proportional to the concentration of the colored chemical.
Path Length
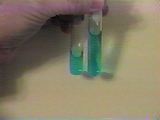
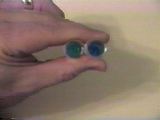
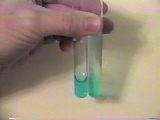
Another factor is the thickness of the solution through which the light must pass. Here we have two samples of the same solution. From the side they have the same color intensity because both test tubes have the same thickness. But looking down through the tube, the tube with the greater sample height absorbs more of the complementary light and has a more intense color. Ideally, the absorbance is directly proportional to the thickness or path length. |
|
|
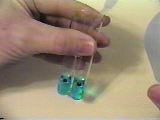
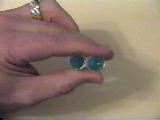
Here is another angle on that. If we start with identical solutions and dilute one, the increased path length makes up for the decreased concentration. |
|
|
|
|
Beer's Law
Beer's Law is often written in the form of this equation A = abc as a way of summarizing and quantifying the relationship between the absorbance, the nature of the absorbing chemical, the path length of the solution, and the concentration of the solution. It expresses the ideal situation in which these factors are truly proportional to the absorbance.
A |
The symbol "A" stands for the absorbance which you will measure with an instrument. |
c |
The symbol "c" stands for concentration measured in molarity. |
b |
The symbol "b" stands for the path length measured in centimeters. |
a |
The symbol "a" is a proportionality factor called the molar absorptivity which is how much light will be absorbed by 1 cm of a 1 M solution of this chemical. Its value depends on what the chemical is and also on what wavelength (or color) of light is being used. |
Colorimeters
There are a number of instruments which can be used to determine the concentration of colored solutions. Among the simplest and most common are the spectrometers.
When you are in the lab, you should practice operating these instruments by finding and measuring the practice solutions in the lab. With each practice solution there will be some appropriate information, such as the wavelength to be used and so forth. Follow the operation steps found on the spectrometers, except that the instruments will probably already be turned on and warmed up. (If you are the first one to use them in the morning, however, they may need to be turned on and allowed to warm up for 5-10 min before you begin working with them.)
After you have practiced operating the instruments using the practice solutions, there remains the problem of actually figuring out the concentration of a solution from the absorbance measurements that can be made using the colorimeters. That will be dealt with in the section on Calculations for Colorimetry. After that you will put it all together by doing the Lab Work necessary to obtain the data needed to experimentally determine the concentration of an unknown solution.
Calculations for Colorimetry
Along with operating the instruments, colorimetry also involves calculations to actually figure out the concentration of a solution from the absorbance measurements made by using the colorimeters. There are three methods that can be used depending on what information is available. They involve using proportionality, graphing and Beer's Law.
One example of each is shown in the following problems (which are also shown in example 8 in your workbook). After you look at those examples try your hand with the practice problems that follow (also given in example 9 in your workbook).
Proportionality Example
The proportionality approach to these kinds of problems focuses on the idea that the absorbance of a solution is directly proportional to its concentration. When using this approach it is necessary to be sure that the values given are for different concentrations of the same chemical measured under the same conditions (wavelength and path length). |
|
||||||||||||||||||
The solution to this problem can be set up using the equation shown in the top left box shown here, which simply says that the ratio of the concentrations is proportional to the ratio of absorbances. We can use c1 to represent the unknown concentration. For the next steps you have your choice of rearranging the equation to solve for c1 and then substituting the known values (down then right) or substituting the known values and then rearranging the equation to solve for c1 (right then down). Then finish up by carrying out the calculations. |
|
Graphing Example
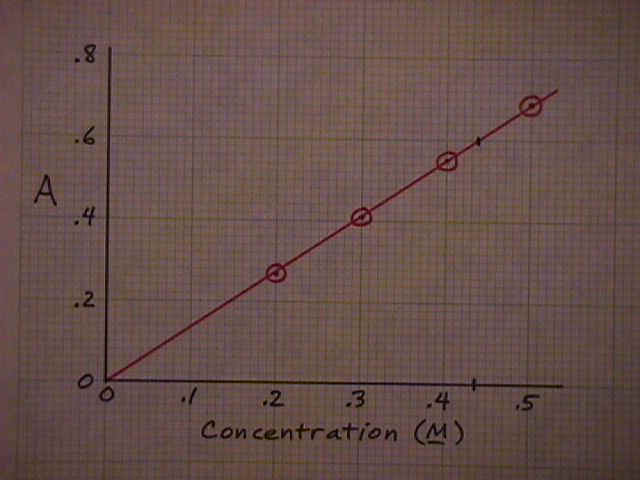
The graphing method is called for when several sets of data are available for concentration and absorbance. Graphing the data allows you to check the assumption that Beer's Law is valid by looking for a straight-line relationship for the data. Note that you could use the data here to do this calculation by the proportionality method but you would have to chose which of the four sets of data to use as the standard. There is also enough data here to use the Beer's Law Equation if you chose to do that. |
|
|||||||||||
The solution to the problem here is to graph the data (red circles) and draw a straight line through the points. If the data points are on or close to the line, that will confirm that the absorbance and concentration are proportional and Beer's Law is valid for this situation. Then find the point on the line that corresponds to the desired absorbance (0.60). Read the corresponding concentration off the scale below (0.437M). |
|
Beer's Law Example
Using the Beer's Law Equation makes the most sense when you are given the molar absorptivity or have the necessary data to calculate it. (Note that if you do have to calculate the molar absorptivity it will probably be easier to use one of the other methods.) |
|
||||||||||||
The way to solve this problem using Beer's Law is to first write down the equation. Then rearrange the equation to solve for concentration. Then substitute the known values. (Of course, these two steps can be reversed if you wish.) Finally, carry out the calculations to get the answer (0.40M). |
|
Colorimetry Calculations - Practice
Use the following questions to test your ability to do colorimetry calculations. Use any or all of the methods above. The answers follow. (Tese questions are also given in example 9 in your workbook.)
a |
Using the data from the graphing example above, what are the concentrations of solutions with absorbances of 0.20, 0.33, and 0.47? |
b |
A solution is prepared to be 0.200M. A sample of this solution 1.00 cm thick has an absorbance of 0.125 measured at 470nm and an absorbance of 0.070 measured at 550nm. Calculate the concentrations of the following solutions: |
| Sample | Absorbance | Wavelength | Path length |
| 1 | 0.055 | 470nm | 1.00cm |
| 2 | 0.155 | 470nm | 1.00cm |
| 3 | 0.120 | 550nm | 1.00cm |
| 4 | 0.048 | 550nm | 5.00cm |
c |
What assumptions did you make when answering the previous questions? |
Colorimetry Calculations - Answers
Here are the answers to the questions above.
a |
Using the data from the graphing example above, what are the concentrations of solutions with absorbances of 0.20, 0.33, and 0.47?
|
b |
A solution is prepared to be 0.200M. A sample of this solution 1.00 cm thick has an absorbance of 0.125 measured at 470nm and an absorbance of 0.070 measured at 550nm. Calculate the concentrations of the following solutions: |
| Sample | Absorbance | Wavelength | Path length | Concentration |
| 1 | 0.055 | 470nm | 1.00cm | 0.088M |
| 2 | 0.155 | 470nm | 1.00cm | 0.248M |
| 3 | 0.120 | 550nm | 1.00cm | 0.343M |
| 4 | 0.048 | 550nm | 5.00cm | 0.027M |
c |
What assumptions did you make when answering the previous questions? That Beer's Law is valid in each case (or that the concentration and absorbance are indeed proportional in each case). |
Lab Work
The instructions for your lab exercise for this lesson are in your workbook.
Briefly, you will prepare several solutions of a specific chemical at different concentrations. Report each measurement and the concentration of each solution in your data sheet. You will label one of your middle-concentration solutions with a code word, and it will be used by other student groups as an unknown.
Calculate the concentration of each prepared solution based on your data. Measure the absorbance of each solution (at the appropriate wavelength), plot absorption vs. concentration, determine the validity of Beer's Law and create a calibration curve. You should use a computer graphing program, like Excel, to create your calibration curve. Obtain two unknown solutions (one class unknown and one solution prepared by another student) and measure the absorbance of each. Determine the concentration of the unknown solutions graphically and by calculation.
You will need to turn in a typed formal lab report for this experiment.